It is interesting how much stock people are willing to place in blood tests and any other kind of test for that matter. It must be remembered that computers only do that which humans program them to do. Likewise, the significance of certain statistics depends on who’s interpreting them and the usefulness of tests also depends upon how they are being interpreted. It is interesting that we (possibly because of our perception of our medical technology) are easily convinced by the results of almost any scientific tests. Let me take a moment now to put tests into a little perspective. Contrary to popular thinking that tells us that blood tests, x-rays, or other kinds of tests are always conclusive, they are more frequently than not equivocal and non-conclusive.
Nevertheless, with our increased reliance on technology, frequently people are led to believe that these tests are extremely conclusive. Somehow this might be brought about by the notion that if a machine costs $600,000 or $700,000 and it can measure intricately the vacillations of the electron clouds of the tissues of the body or something equally amazing and mind boggling, then the results must necessarily be conclusive and useful in all situations, which is, of course, not always the case.
One must realize that tests are not 100% accurate. When one uses a test to determine whether or not someone has a disease, the test sometimes will be positive and sometimes negative. When a test is positive and the test is correct, then that is called a true positive. When the test is positive and the test is incorrect, it is a false positive. When the test is negative and it is correct, then it is a true negative. When the test is negative and the test is incorrect, then it is a false negative. One must remember when choosing a test one is attempting to find a test that has few false positives and few false negatives. In medicine there isn’t anything that is exact or 100%. The fewer false negatives and the fewer false positives a test has, the more reliable and the more useful it is.
Normal Range
A few comments should be addressed to the “normal range,” since so many people are often dismissed as having no physical abnormality on the basis of their blood tests being within the “normal range.” When they do have a physical abnormality that doesn’t show up on a particular test looking for a particular problem then this is what is known as a false negative. It must be remembered that the “normal range” is an arbitrary setting of upper and lower limits in order to establish who does and who does not have a problem. As everyone well knows, what is normal for one person is not necessarily normal for another. Everyone is different. Some people are low, some people are a little higher, and some are higher still. If one plots the number of people having a certain value against the possible values that the tests can give, one finds that in almost any type of medical test, the distribution will follow what is known as a “Bell Curve”. It is called this because it is shaped like a bell. Most people will tend to have similar values (representing the middle of the distribution). With fewer people having extremely low or extremely high values, the curve takes on a bell shape.
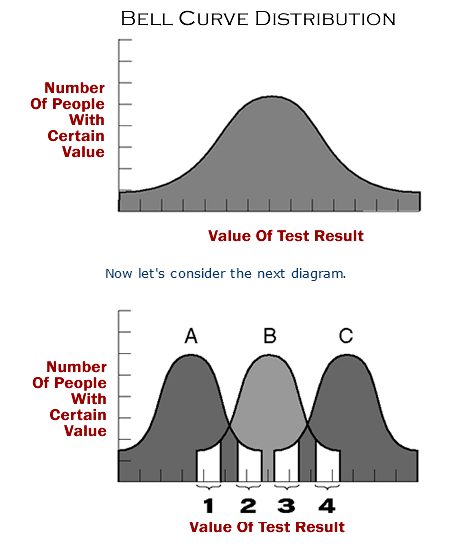
Let’s suppose there are three groups of people. Group A are people who have a physical abnormality that causes their values to run below normal, on average. Let’s suppose that Group B is a group of persons who are not sick with an illness with which this particular test correlates. Group C are people who are sick with an illness that causes the values of this particular test to be above normal, on average. By looking at the first shaded area, we can see that some people who are normal have values that are actually more typical of those who have an illness that causes low values. In the second shaded area, we can see that there are some people who are sick that have values that are very much at a level that would be consistent with a normal person. In section three we can see that some of the people who are sick with a sickness that can cause high values also have levels that are more consistent with people who are without illness. In section four we can see that there are some people who are without sickness, who have values that are typical for people who have a sickness that causes elevated levels, on average. So this diagram points out what everyone already knows, and that is: what is normal for one person is not necessarily normal for another.
Without getting too deep into statistics, I would like to point out some common sense reasoning as it relates to “ranges of normal.”
The Bell Curve shape has a curved central portion with tails on either side.
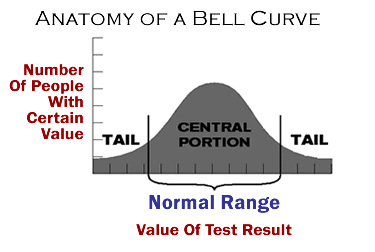
These bell curves can be of different shapes for different tests. Some may be broad and some may be narrow. Broad central portions indicate that the observations obtained have a greater degree of variation in different people, and narrow ranges of normal indicate that the test value of each person tends to be much more similar to the values of other people.
As we discussed earlier, entropy is the nature of all things to go toward disorder. If there is no influence causing things to be otherwise, things naturally tend to be random. Tests that have random results form a curve shaped like a rectangle as seen at the top of the following diagram. There is no influence that is causing any one particular value to be found any more commonly than any other possible value. This causes the curve to take on a flat shape. But as influences become stronger in affecting the outcome of a certain test, the shape of the curve becomes less like that of a random test and will take on more of a bell-shaped curve.
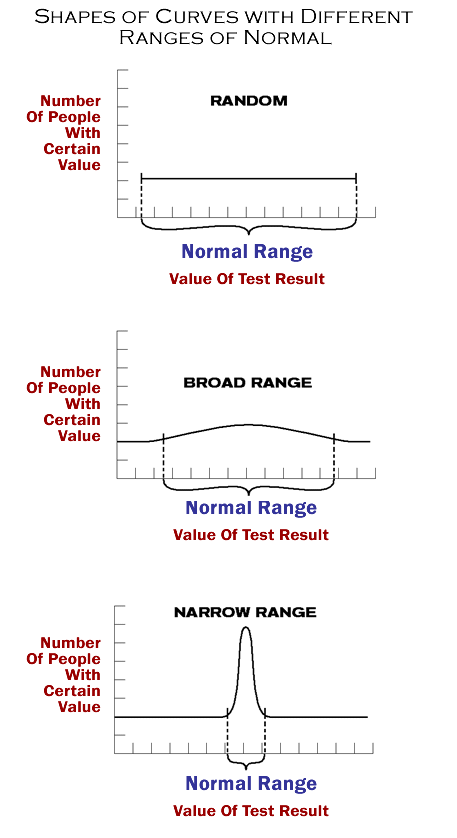 The stronger the influence, the stronger the shaping effect on the curve. It is the nature of tests to come out with a disordered, random, or flat-shaped curve. If some values occur much more commonly than others, it is not an accident. The stronger the tendency for obtaining a certain result over others, the stronger the likelihood that there must be a very strong influence. So in that sense, the flatter the curve, the more random its nature, and the less specifically the values of a particular test are being influenced. The more peaked the curve, the more likely it is that there is a very specific reason for the peaking, and the more meaningful the test may be (See above Diagram).
Limitations Of Thyroid Blood Tests
As it turns out, there is a very good reason that thyroid hormone blood tests are not always of great predictive value in the resolution of the symptoms of decreased thyroid system function.
It’s because thyroid hormones don’t have their action in the bloodstream, they have their action at the site of the nuclear membrane receptors of the cells. The thyroid hormones, especially T3, interact with the thyroid hormone receptor much the same way a key interacts with a lock so that it may be opened.
At this time, in spite of our vast technology, there is no way to measure that action. Not for the past forty years, not now, and probably not for another twenty years, can that be measured directly. Historically, doctors have tried to estimate or predict that action based on what floats around in the bloodstream. But common sense tells us that, at best, these blood tests are just an indirect measure of what happens at the cells. And the symptoms of DTSF are caused specifically by low body temperature pattern abnormalities resulting from inadequate thyroid hormone stimulation of the thyroid hormone receptor sites.
So blood tests are very useful in assessing the function of the glands of the thyroid system, however, they are frequently hard to correlate with the onset and resolution of the symptoms of DTSF. The symptoms of DTSF ultimately depend on what happens in the cells of the body, not the bloodstream. Therefore, the thyroid hormone blood tests are useful in assessing the function of the glands of the thyroid system, but cannot and do not directly measure where the “rubber meets the road” in terms of the presence or absence of the symptoms of DTSF.
Most cases of DTSF are caused by Wilson’s Temperature Syndrome. Since Wilson’s Temperature Syndrome is an impairment in the peripheral conversion of T4 to T3 (outside the glands of the thyroid system), it is easy to understand why blood tests are not very predictive in directing treatment of the symptoms.
Historically, thyroid blood tests have been used in order to try to estimate what will happen at the active site, but the body temperature can be used to get a better picture of what actually has happened at the active site. Thus, the monitoring of body temperature patterns is a more direct reflection of the adequacy of the thyroid hormone/thyroid hormone receptor interactions of the body.
Since the symptoms are due to abnormal body temperature patterns, it is also easy to understand why body temperature patterns are so useful in the treatment of the symptoms of DTSF. It is the best indicator that we have. So treatment of DTSF that does not take body temperature patterns into consideration, isn’t being done correctly. If thyroid hormone/thyroid hormone receptor interactions are ever able to be measured directly, such a measurement will add very little to the predictive value already provided by the body temperature patterns (because the temperature already measures the bottom line: the body temperature!).
These facts have led to a great deal of confusion and frustration. I feel that because the limitations of thyroid blood tests are not always borne in mind, false assumptions are made which is one of the biggest reasons that DTSF is so frequently overlooked.
Do Blood Tests Or Temperature Better Reflect Thyroid Stimulation Of The Cells?
It is well known that thyroid hormone levels and body temperature patterns are related. And, it’s known that if thyroid hormone levels in the blood drop to very low levels, then a patient’s body temperature can drop well below normal and the patient can even become comatose. It is also well known that patients who have thyroid blood tests that are exceedingly high can often have fevers well over 100 degrees in a condition that is sometimes called “thyroid storm.”
When thyroid blood levels go too high, the temperature can go too high, and when thyroid blood levels go too low, the temperature can go too low. In either extreme, severe symptoms can result. So both tests, thyroid blood tests, and temperature tests can both be correlated to conditions and sickness.
Which test, then, is best able to predict when a person is suffering from inadequate thyroid hormone stimulation, or when a person has excessive thyroid hormone stimulation at the site of the thyroid hormone receptors? To help us answer this question, let us consider the shapes of the curves of distribution of values of these tests when they are performed in a large number of people. To do this, let’s again remember the principle of entropy, the tendency of all things to go toward disorder. Let us remember, also, that the significance of any test values can be measured, to an extent, by considering how that value compares to what value one would expect in a random situation.
Considering The Thyroid Blood Tests
Thyroid hormones do not grow on trees and they don’t exist in nature by accident. That can be demonstrated when one considers that without a thyroid gland there is no thyroid hormone production and, therefore, no thyroid hormone levels would be found in the body. So if the thyroid gland was not present or not functioning, then one would expect to find no hormone. So any thyroid hormone levels detected in the body represent a non-random occurrence.
For our purposes, let us consider four of the more than ten thyroid hormone blood tests available. Generally speaking, ranges of normal contain primarily the central portion of a bell curve (see diagram 4-3). Regardless of how narrow or broad a bell curve, the central portion of the curve contains a constant percentage of the measurements taken.
For our purposes, let us say that percentage is 80%. So that means that the central portion of each bell curve contains 80% of the measured values. In medical tests, normal ranges are often obtained by finding the central portion of the bell curve. The lower end of the central portion is represented by the “lower limit” of normal and the upper end of the central portion is represented by the “upper limit” of normal.
|
Let us now consider the upper and lower limits of normal for four of the thyroid hormone blood tests available (Refer to above table). The first test to be considered is the T4 test. The lower limit of normal equals 4.5, and the upper limit of normal equals 13.0 micrograms per deciliter.
The second test is TSH. Lower and upper limits of normal are 0.4 and 6.0 microinternational units per milliliter respectively.
The third is Reverse T3 (RT3). 100 is the lower limit of normal and 500 picograms per milliliter the upper.
The fourth test is T3, lower limit of normal is 55, upper limit, 171 nanogram per deciliter.
Considering that in the random situation one would expect no thyroid hormone levels to be present, since they are not formed out of the blue by themselves, then these upper and lower limits of normal can be considered to represent a certain number of units above what one would consider random. Referring back to diagram 4-4 of a random curve, a broad curve, and a very peaked curve, you can see that the random curve is flat which causes the two ends of the “central portion of the curve” to be as far as part as possible. In the broader bell-shaped curve, one can see that the upper and lower ends of the central portion of the curve are closer together yet still wide apart. In the extremely peaked bell-shaped curve, the two ends of the central portion of the curve are extremely close together. So, the closer together the ends of the central portion of the curve, the more peaked the curve is. The more peaked the curve, the more dissimilar the curve is to that of a random situation.
Let us now consider, in percentage form, how far apart the ends of the central portion of the curves are for the four thyroid hormone blood tests previously discussed. With T4, the upper limit of normal is 2.9 times higher than the lower limit of normal. For TSH, the upper limit is 15 times higher than the lower limit of normal. For RT3 the upper limit is 5 times higher than the lower limit, and with T3 the upper limit of normal is 3.1 times the lower limit of normal. Therefore, in a T4 test, there is a 190% difference between the upper and lower limit of normal. For TSH there is a 1400% difference. For RT3 there is a 400% difference. And with T3, there is a 210% difference between the upper and lower limits or normal. One can see by these considerations that the TSH curve is much broader than the T4 and T3 curves. Therefore, the TSH curve more closely approaches the shape of a curve of a random situation.
Considering The Body Temperature’s Range Of Normal
When one considers that it would be the natural tendency of a body to be the same temperature as its surroundings, then one may consider the number of degrees a body temperature is above room temperature to be the number of units away from what one would consider a random situation. We shall use 75 degrees as room temperature. Fever is considered to be 100 degrees Fahrenheit and we will consider this to be the upper limits of normal. 97.0 degrees is probably lower than the lower end of the central portion of the curve for body temperature, but for our purposes we will consider this to be the lower limit of normal. 100 degrees minus 75 degrees equals 25 degrees, which we will consider the upper limit of normal as compared to the random situation (room temperature). 97.0 degrees minus 75 degrees is 22.0 degrees which we will consider the lower limit of normal above the random situation. 25 degrees is 1.14 times higher than 22.0 degrees and therefore, the upper limit of normal is 14% greater than the lower limit of normal. We can see by comparing this percentage difference to the percentage differences of the thyroid hormone blood tests that the ends of the central portion of the temperature curve are much closer to each other than the ends of the central portion of any of the thyroid test curves. This indicates a much less random situation, therefore, there must be an extremely strong influence involved. This 14% difference between the upper and lower limits of normal is especially interesting when compared to the hundreds and hundreds of percentage points difference in the upper and lower limits of the thyroid blood tests.
Extremely peaked bell curves do not happen by accident and the greater the peaking, the less accidental the situation. Again, they are about as likely as tossing a deck of cards in the air and having them land as a card house. The values of the thyroid hormone blood tests and the body temperature are related to the extent that extremely low blood values can be related to extremely low temperatures and extremely high blood values can be related to extremely high temperatures; and both the thyroid hormones and body temperature are intimately related to the thyroid hormone/thyroid hormone receptor interaction at the nuclear membrane of the cells.
The question remains, which test better reflects the influence and purpose of the all important thyroid hormone/thyroid hormone receptor interaction? Since they are related, it would seem that if it were critical that the body maintain a particular set of values for the thyroid blood tests, then the body temperature patterns would vary widely from person to person to accommodate specific thyroid blood test values. Conversely, if it were critical that the body maintain a particular body temperature level, then it would make sense that the thyroid blood tests values would vary widely to maintain a certain body temperature level. When one considers that the percentage difference between the upper and lower limits of normal for TSH are 1400%, and the percentage difference between the upper and lower limits of normal for the body temperature is 14%, it’s easy to see which curve more represents a nonrandom situation and which one fluctuates widely to keep the other at a certain level. It appears that the thyroid hormone blood levels are regulated to fluctuate widely in order to provide for the temperature rather than the other way around. If it is the purpose of the thyroid hormones to fluctuate widely to ensure a certain temperature, then would the thyroid hormone that fluctuates the widest be any more important than the others in accomplishing that purpose?
It is interesting to see that the TSH (thyroid stimulating hormone) test has the widest range of normal of the thyroid blood tests, suggesting that it may be designed, more than any other thyroid system hormone, to ensure a normal body temperature pattern. It is interesting, because TSH is the blood test currently regarded as the most sensitive reflection of thyroid gland function. But if TSH is regulated to fluctuate widely to help ensure a normal temperature pattern, then it is easy to see how the best indicator of the adequacy of the process is the end result, the body temperature, itself.
For example, the study habits of students who are trying to score well on a certain test may vary widely. A more confident student may decide not to study very hard, while one with less background might choose to be more diligent. One could try to measure the adequacy of their preparation for the test by how hard they studied, but a more accurate method would be by their actual scores.
Some people consider body temperature patterns to be a more vague and non-conclusive reflection of thyroid system function, because, “everyone’s different, and a lot of people have body temperatures that are lower than the average.” This is an unusual argument, considering that just as many people have thyroid blood studies that are lower than the average, and their values vary to a much greater degree than do their body temperature patterns. We must remember that the “ranges of normal” are arbitrarily set in an attempt to make the thyroid tests as useful as possible. Thyroid hormone blood tests are invaluable in helping to evaluate and regulate the thyroid system, especially the portion in which the function of the glands are important. However, the fact that there is only a 14% difference between the upper and lower limits of normal for body temperature readings indicates that the body temperature readings far better reflect the status of the thyroid hormone stimulation of the thyroid hormone receptors.
This leads me to believe that the thyroid hormone/ thyroid hormone receptor interactions are regulated in such a way as to provide such specific and consistent body temperature patterns for an extremely important purpose. And I believe that extremely significant purpose is to help provide the optimal conditions for the enzymatically-catalyzed reactions of the body, thereby affecting virtually every bodily function. Thus, the reason for the maintaining of extremely specific and consistent body temperature patterns is that essentially all the bodily functions depend upon it. Since thyroid blood tests fluctuate widely, it is easy to see why temperatures end up having much greater predictive value, in relation to the symptoms of DTSF, than thyroid hormone blood tests. Just because a test is more expensive or difficult to perform does not necessarily mean it is better or more useful.